

George Rebane
[This piece continues the RR series on the US economy and the factors taking it into new regions – unknown unknowns – during these pre-Singularity years. As usual, the frail and the young should be spared from these deliberations.]
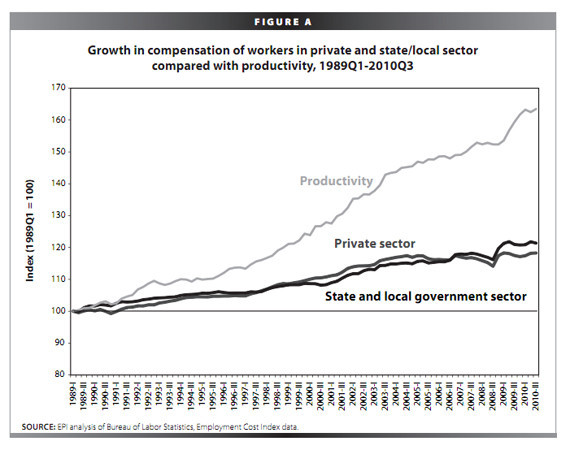
Productivity of a nation’s workforce is an important metric in understanding its prospects for growth and its ability to compete globally. The bottom line metric of workforce productivity has been to divide gross national product (GDP) by the number of workers involved in producing it. But puzzling on it a bit reveals that there’s more to the story. After all, we are talking about a nation’s ability to output product at some level of unit cost – note that I did not say ‘unit of labor cost’.
Since the GDP of a country includes government spending, and since a big part of what government spends is in transfer payments that don’t directly support production (see figure in endnote), shouldn’t that somehow enter the productivity calculation? Also, workforce members not participating, due to a number of reasons, are still sustained by the economy (to a large part by transfer payments), should they not be factored in since they remain as a ballast or deadweight in their unemployed condition?
In short, if we were to compute a true productivity index for a nation in the units of productive GDP per each member of the workforce, whether employed or not, then we should compensate that index for these factors since they affect both growth and global competitiveness. My effort to do that required searching for a lot of data that could be used commensurately. The result is shown as the ‘Available Workforce Compensated Productivity Index’ (AWCPI) which uses the workforce as consisting of the total of employed and unemployed for any given year. The GDP is compensated by subtracting out that year’s direct transfer payments, but leaving in any multiplier effect from such payments – i.e. a consumer spending his unemployment check on household expenses, entertainment, etc.

All the government reported nominal dollar amounts in the AWCPI are appropriately discounted to the official chained government price deflator (‘inflation index’) anchored at 2005. This allows us to do an apples-to-apples comparison over the 22 year time interval that is shown.
The disquieting part of the plot is its relative flatness since 2000. Advances in technology have provided an enormous amount of sector specific productivity gains during the last decades. But when we make these gains ‘carry the weight’ of non-workers, and take out direct payments to people who don’t produce, then our economy has made little or no real gains in productivity in recent years.
The effects of low growth in real productivity are twofold – 1) it does not portend well for us globally because second and third world countries have learned to produce more for lower costs, and 2) since wealth is produced by fewer and fewer workers, that wealth tends to concentrate enormously in the hands of those who can put technology and competitive labor to work together efficiently. Such wealth disparities are a call to arms for every leftist naïf and class warfare warrior in the land (you can hear them howling on these very same pages).
We have covered the politics and economics of this phenomenom for the last years, and will continue to do so as Obama intends to make the situation worse and capitalize on the political outfall of it during his years in office. Here all I want to do is introduce a new perspective that helps explain away why and what is happening with regard to our economic doldrums, unemployment, federal deficits, bankruptcy of local jurisdictions, and ultimately the financial ruin that faces us and causes the feds to prepare for large scale civil strife. Enjoy.
Endnote: Please refer to the previous posts on my prognostications on unemployment, understanding GDP components, and the relationship between the growth of GDP, productivity, and the workforce. Below I have included the GDP flowchart for reference and your convenience.


Leave a comment